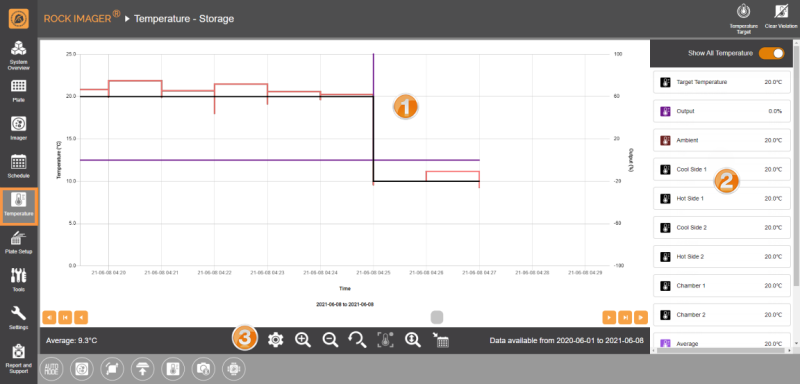
The ROCK IMAGER®’s storage temperature can be controlled and set anywhere from 4° C up to 30° C in order to help you optimize your crystallization experiments. The Temperature menu provides a graph that illustrates the current temperature and the ROCK IMAGER®’s temperature history. You can also view specific temperature data for particular time periods.

Temperature Menu
| |
| The Graph shows current temperature data from your ROCK IMAGER® instrument or shows you saved temperature data from a previous point in time. It consists of a single X axis and two Y axes. The X axis displays the Time of the temperature recording in the chosen interval, whereas the Y axes display the Temperature level and the Output. The Temperature is represented in degrees Celsius, while the Output of the temperature controller is represented as the percentage of total possible power usage for the temperature control. The data taken from each temperature sensor in ROCK IMAGER® is displayed in a different color, for easy identification. See the Current Readings panel in the row below for more information. To see the exact reading from a sensor, hover your mouse over the corresponding sensor line on the Graph. Information Tooltip That Appears When Hovering the Mouse Over a Sensor Line
Use the buttons under the Graph to move through different points in time from the temperature record’s history.
 — Jumps to the earliest temperature data recorded on the day before the currently opened data was recorded. — Jumps to the earliest temperature data recorded on the day before the currently opened data was recorded. — Jumps to the earliest temperature data recorded on the day after the currently opened data was recorded. — Jumps to the earliest temperature data recorded on the day after the currently opened data was recorded. — Jumps to the earliest temperature data recorded the same day you open the data. — Jumps to the earliest temperature data recorded the same day you open the data. — Jumps to the latest temperature data recorded the same day you open the data. — Jumps to the latest temperature data recorded the same day you open the data. — Moves the graph to the left in one minute intervals. — Moves the graph to the left in one minute intervals. — Moves the graph to the right in one minute time intervals. — Moves the graph to the right in one minute time intervals. |
| The Current Readings panel on the right side of the screen shows you the current temperature data taken from the system’s sensors. Each temperature sensor is represented by a different color line on the graph. The Current Readings panel only shows you current live data, even if you jump to a different period on the graph.
Note: If the Current Readings panel isn’t available yet on the screen, click the Settings button and enable Show Temperature Info. You can also click on a specific sensor in the panel to disable it.
- Target Temperature: Shows the desired temperature you want the system to achieve. Click the Temperature Target icon
 in the upper-right corner of the screen to set one. in the upper-right corner of the screen to set one.
Note: If the system fails to reach the target temperature after a set amount of time, the temperature icon in the Status Bar will blink to notify you. Click the Clear Violation icon  to terminate the violation. to terminate the violation.
- Output: Tells you the percentage of the total possible power result for the temperature control.
- Ambient: Shows you the room temperature value where your ROCK IMAGER® is installed.
- Cool Side 1: Shows you the temperature read by the Cool Side 1 sensor of the system.
- Cool Side 2: Shows you the temperature read by the Cool Side 2 sensor of the system.
- Hot Side 1: Shows you the temperature read by the Hot Side 1 sensor of the system.
- Hot Side 2: Shows you the temperature read by the Hot Side 2 sensor of the system.
- Chamber 1: Shows you the temperature read by the Chamber 1 sensor of the system.
- Chamber 2: Shows you the temperature read by the Chamber 2 sensor of the system.
- Average: Tells you the average temperature of the top and bottom sensors in your ROCK IMAGER® system.
- Minimum: Informs you of the coldest temperature detected by any of the sensors.
- Maximum: Displays the hottest temperature detected by any of the sensors.
|
| The Toolbar consists of :
- Settings button
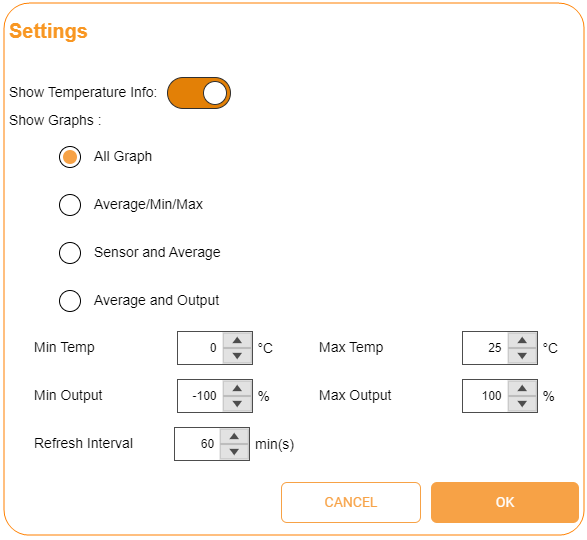
 — Launches the Settings dialog box, as shown in the image below:
[caption id="attachment_6883" align="aligncenter" width="587"] — Launches the Settings dialog box, as shown in the image below:
[caption id="attachment_6883" align="aligncenter" width="587"] Settings Dialog Box[/caption] Settings Dialog Box[/caption]
- The Show Temperature Info option allows you to display the Current Readings panel.
- The Show Graph option lets you choose how you want the live temperature data to be displayed in the Graph area. Select All Graph to display all of the available sensors or Average/Min/Max to display the Average, Minimum, and Maximum of the current temperature results from all sensors.
- The Min Temp, Max Temp, Min Output, and Max Output fields let you define the minimum and maximum values used for the Y axes on the Graph. ROCK IMAGER® can also refresh the Graph data in order to reduce the amount of memory used by the software. Type the desired value in the Refresh Interval field to dictate how frequently the data is refreshed.
- Zoom In button
 — Lets you observe the temperature graph data in a smaller time interval; for example, from days to hours, or minutes to seconds. — Lets you observe the temperature graph data in a smaller time interval; for example, from days to hours, or minutes to seconds.
- Zoom Out button
 — Lets you observe the temperature graph data in a larger time interval;for example, from hours to days, or seconds to minutes. — Lets you observe the temperature graph data in a larger time interval;for example, from hours to days, or seconds to minutes.
- Reset Zoom button
 — Observes the temperature graph at the original zoom. — Observes the temperature graph at the original zoom.
- Best Y Zoom button
 — Adjusts the Y axes’ magnitude to its best view so that all the temperature and output graphic data that are recorded will be properly displayed. — Adjusts the Y axes’ magnitude to its best view so that all the temperature and output graphic data that are recorded will be properly displayed.
- Jump to Date button
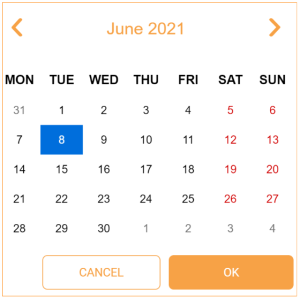
 — Views the temperature data from a certain date. Define the year, month and day as desired in the Calendar window that appears.
[caption id="attachment_6877" align="aligncenter" width="300"] — Views the temperature data from a certain date. Define the year, month and day as desired in the Calendar window that appears.
[caption id="attachment_6877" align="aligncenter" width="300"] Calender Window[/caption] Calender Window[/caption]
|
Frequently Asked Questions:
➤ How will I get notified if the system fails to reach the target temperature?
Answer: The temperature icon in the Status Bar will be flashing orange to notify you. You will also receive an email notification should ROCK IMAGER® fails to reach the target temperature. This allows you to investigate any potential issues with the temperature sensors. Click the Clear Violation icon  in the upper-right corner of the screen to resolve it. Reach out to support@formulatrix.com for assistance.
Related Topics
![]() in the upper-right corner of the screen to resolve it. Reach out to support@formulatrix.com for assistance.
in the upper-right corner of the screen to resolve it. Reach out to support@formulatrix.com for assistance.


