View Image
View Image Page
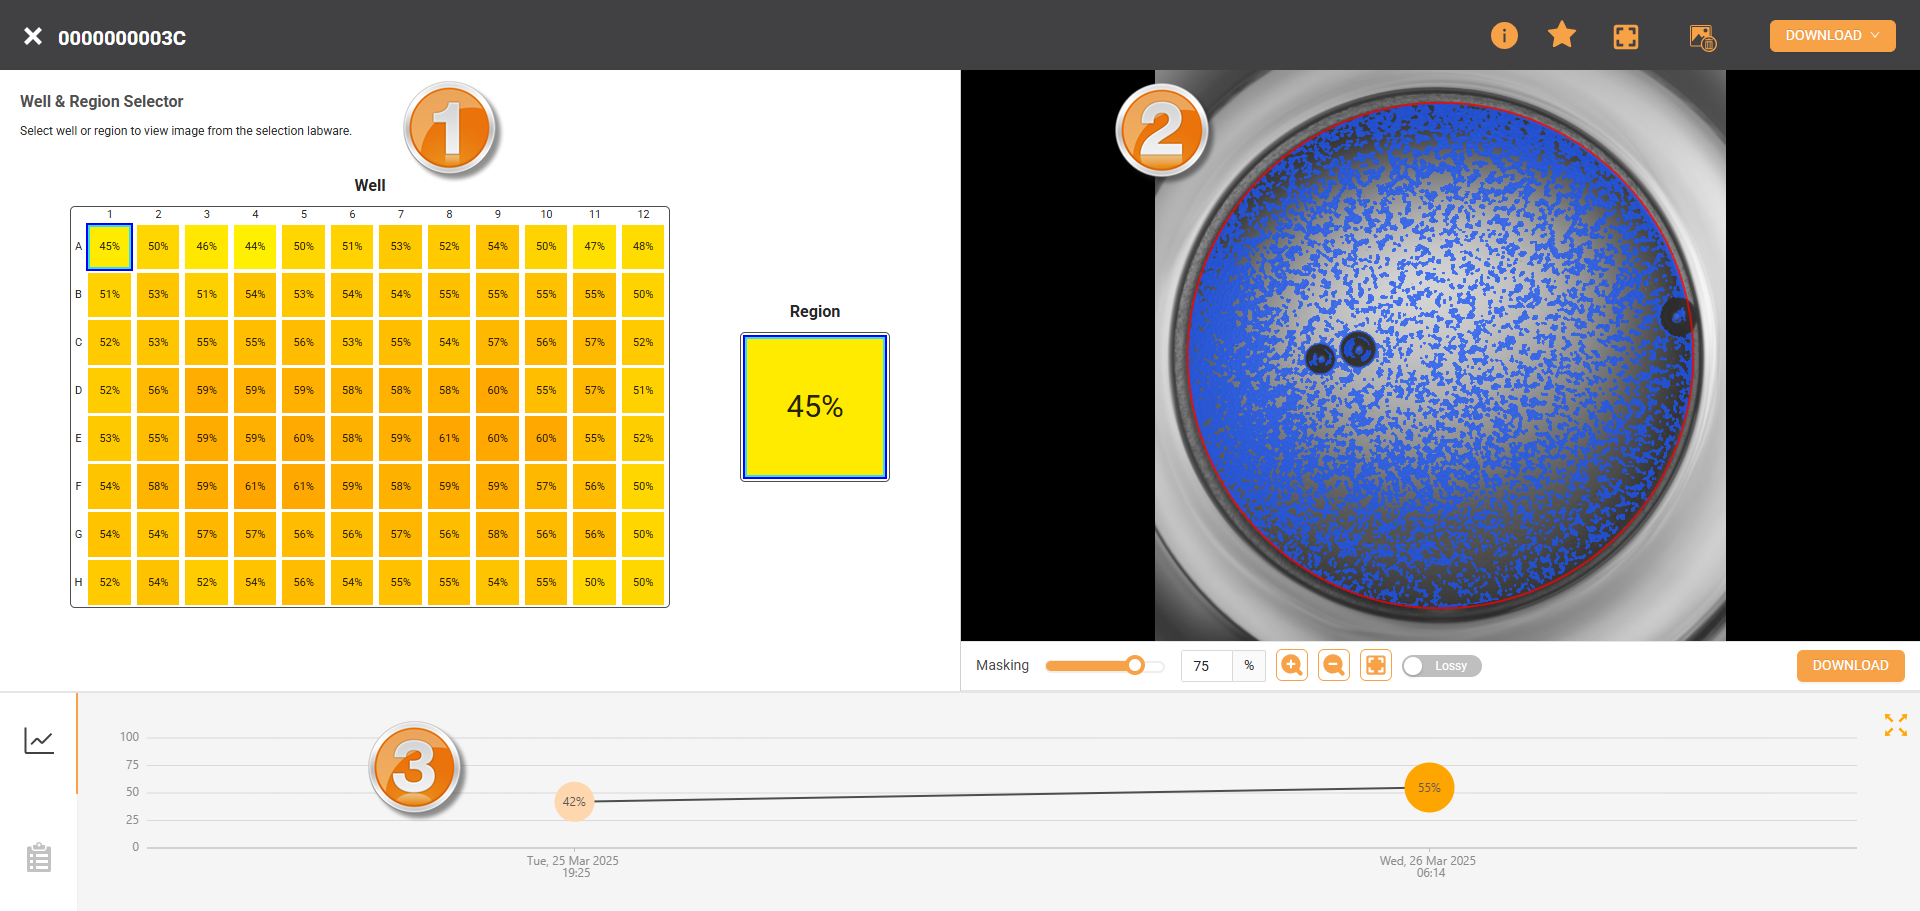
The View Image page provides a comprehensive view of cell confluency progression during experiments, divided into three sections: Well & Region Selector, Image Viewer, and Confluency Analytic.
- Well & Region Selector
The panel presents a visual presentation of the plate with color gradients, indicating cell confluency percentage per well/region. This offers a quick visual overview of confluency across the plate. When a specific well/region is selected, the Image Viewer on the right displays the latest confluency image, and the Confluency Gallery provides a visual progression of confluency in the form of images. - Image Viewer
The panel shows a black-and-white image of the cells from the selected region/well. Users can zoom in, enter fullscreen mode, or apply masking for enhanced visualization. To save individual images for offline analysis, users can select the Download button or Download > Download Bulk Image in the top right corner for multiple images. - Confluency Analytic
This section offers two tabs: Confluency Chart and Confluency Gallery. -
- Confluency Chart: The confluency growth percentages over time. Users can select any stage to view the confluency history, with the corresponding images and confluency data displayed in the Well & Region Selector and Image Viewer.
- Confluency Gallery: A visual timeline of confluency growth in the form of images. When an image is selected, it appears in the Image Viewer and updates the Well & Region Selector.
Users can also download comprehensive confluency data via Download > Download Confluency Data in the top right corner for offline analysis.
To open the View Image page:
- Go to Cell Experiments > Experiments.
- Select the experiment in the Folder Tree panel. The detailed information of the selected experiment should be displayed in the right column.
- Hover over the Three Dots icon
 in the far right column and select View Lineage to open the Lineage page.
 - Select the View Image button in the top right corner to open the page.
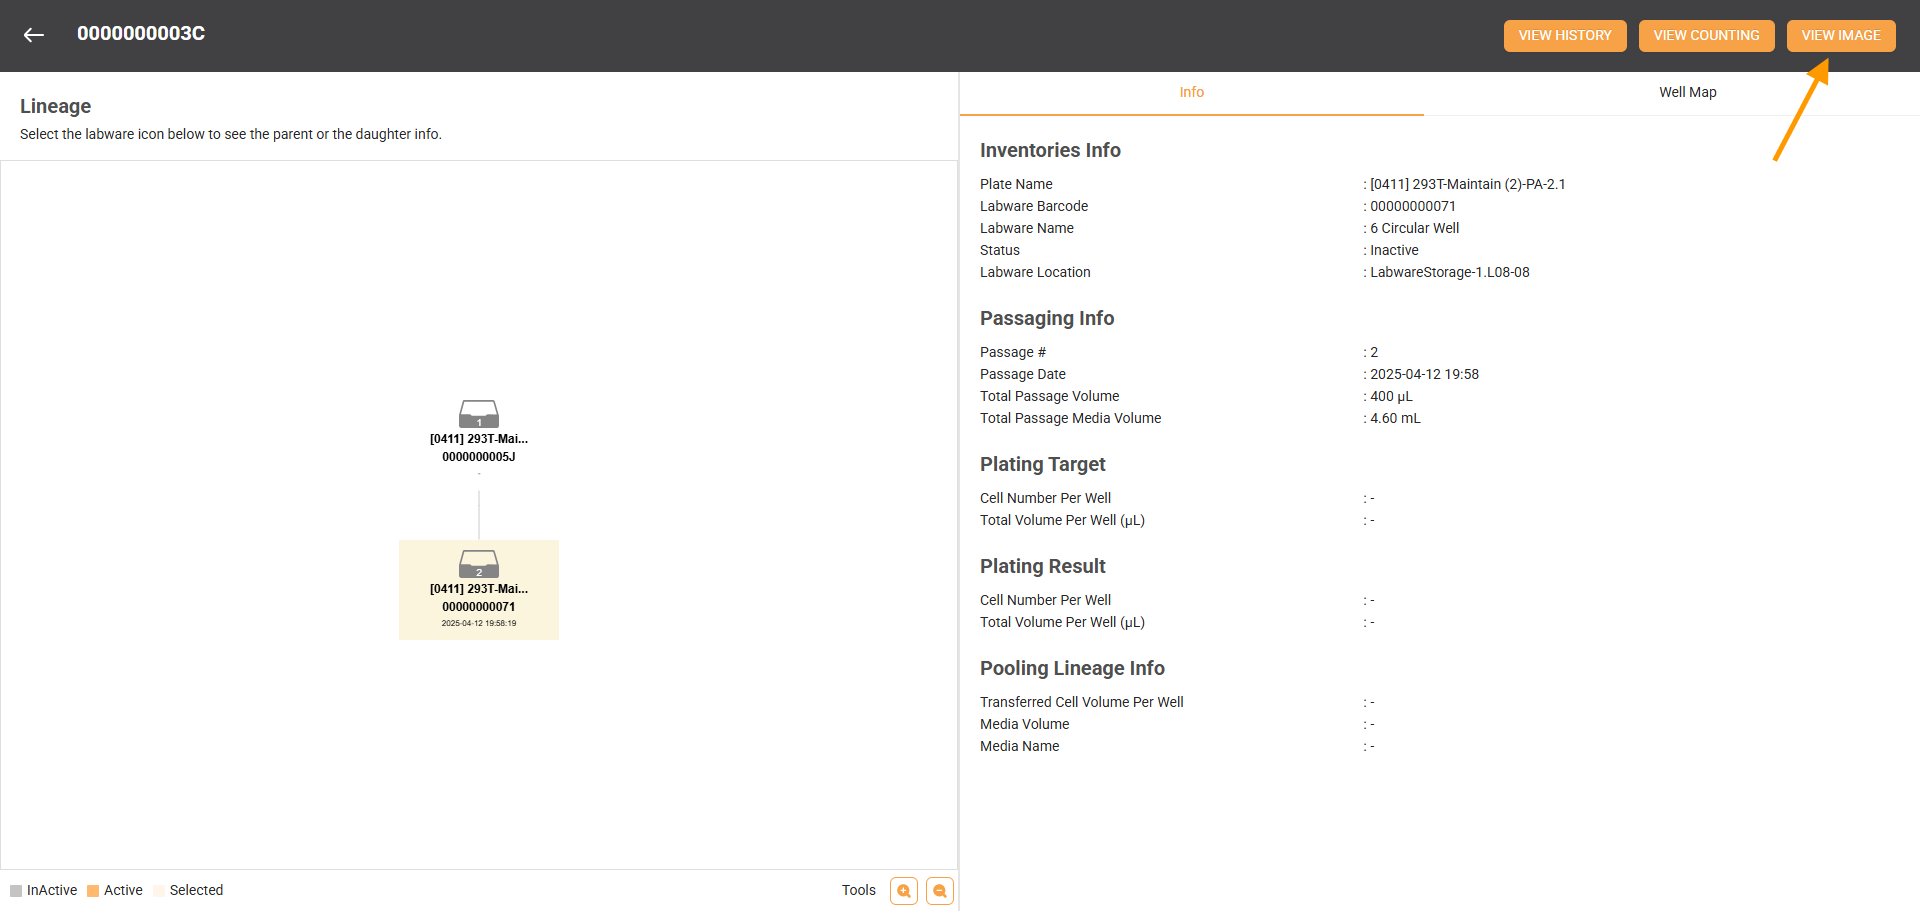
Select View Image