View Counting
View Counting Page
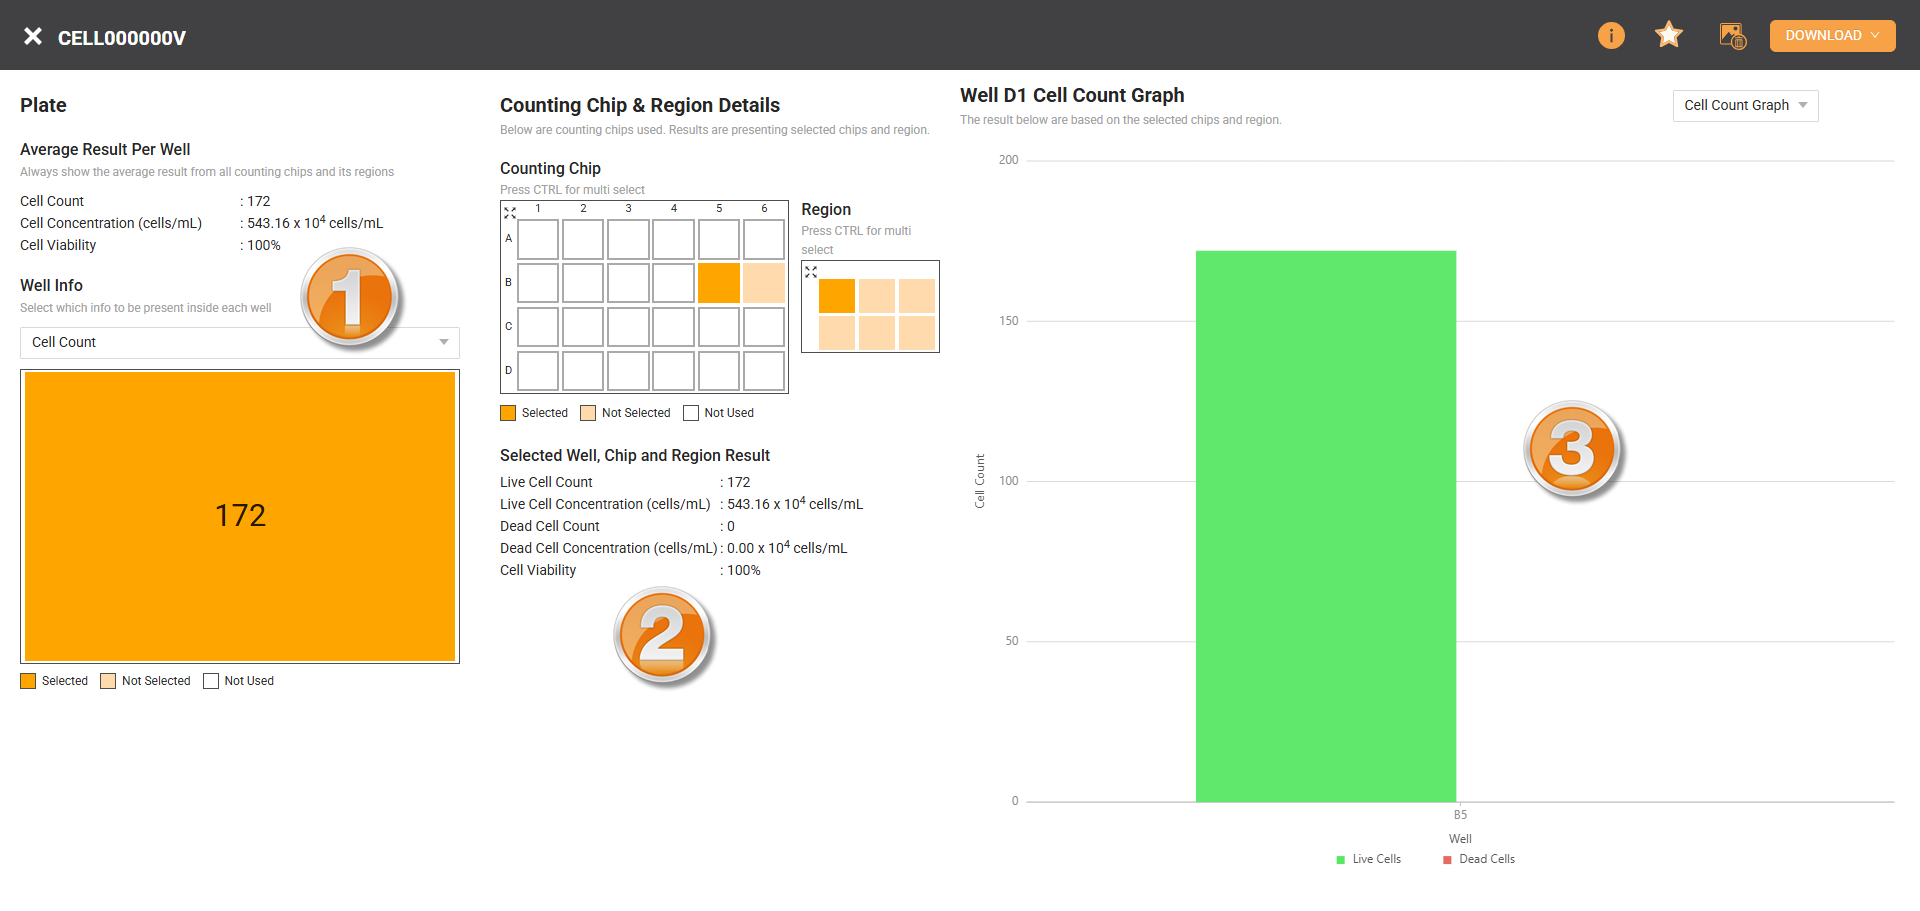
The View Counting page provides a detailed analysis of cell counting, concentration, and viability. The page is divided into three main columns: Plate, Counting Chip & Region Details, and Well Canvas.
- Plate
- Average Result Per Well: A summary of cell count, concentration, and viability across all counting chips and regions.
- Well Info: A dropdown menu to display the data by cell count, concentration, or viability per well.
- Source Plate Image: The microplate layout with each well shows detailed information based on the selected Well Info option.
- Counting Chip & Region DetailsUsers can select multiple chips and regions simultaneously by holding the Ctrl key, and the combined data for these selections will appear in the Well Canvas.
- Counting Chip: The layout of counting chips within a cell counting plate, which includes 24 chips in total.
- Region: The smallest imaging area within a counting chip, with each chip containing 6 regions.
- Selected Well, Chip, and Region Result: A summary of cell viability and non-viability rates for the selected chip and region.
- Well Canvas
- Cell Count Graph: A column chart displaying cell counts from the selected chips, with green bars representing live cells and red bars indicating dead cells.
- Cell Confluency Graph: A blue column chart showing cell confluency based on the selected chips and regions.
- Image: The cell image for the selected region. Users can adjust masking, zoom in/out, enter fullscreen mode for better visualization, and they can also download the image for offline analysis.
To see the View Counting page:
- Go to Cell Experiments > Experiments.
- Select the experiment in the Folder Tree panel. The detailed information of the selected experiment should be displayed in the right column.
- Hover over the Three Dots icon
 in the far right column and select View Lineage to open the Lineage page.
 - Select the View Counting button in the top right corner to open the page.
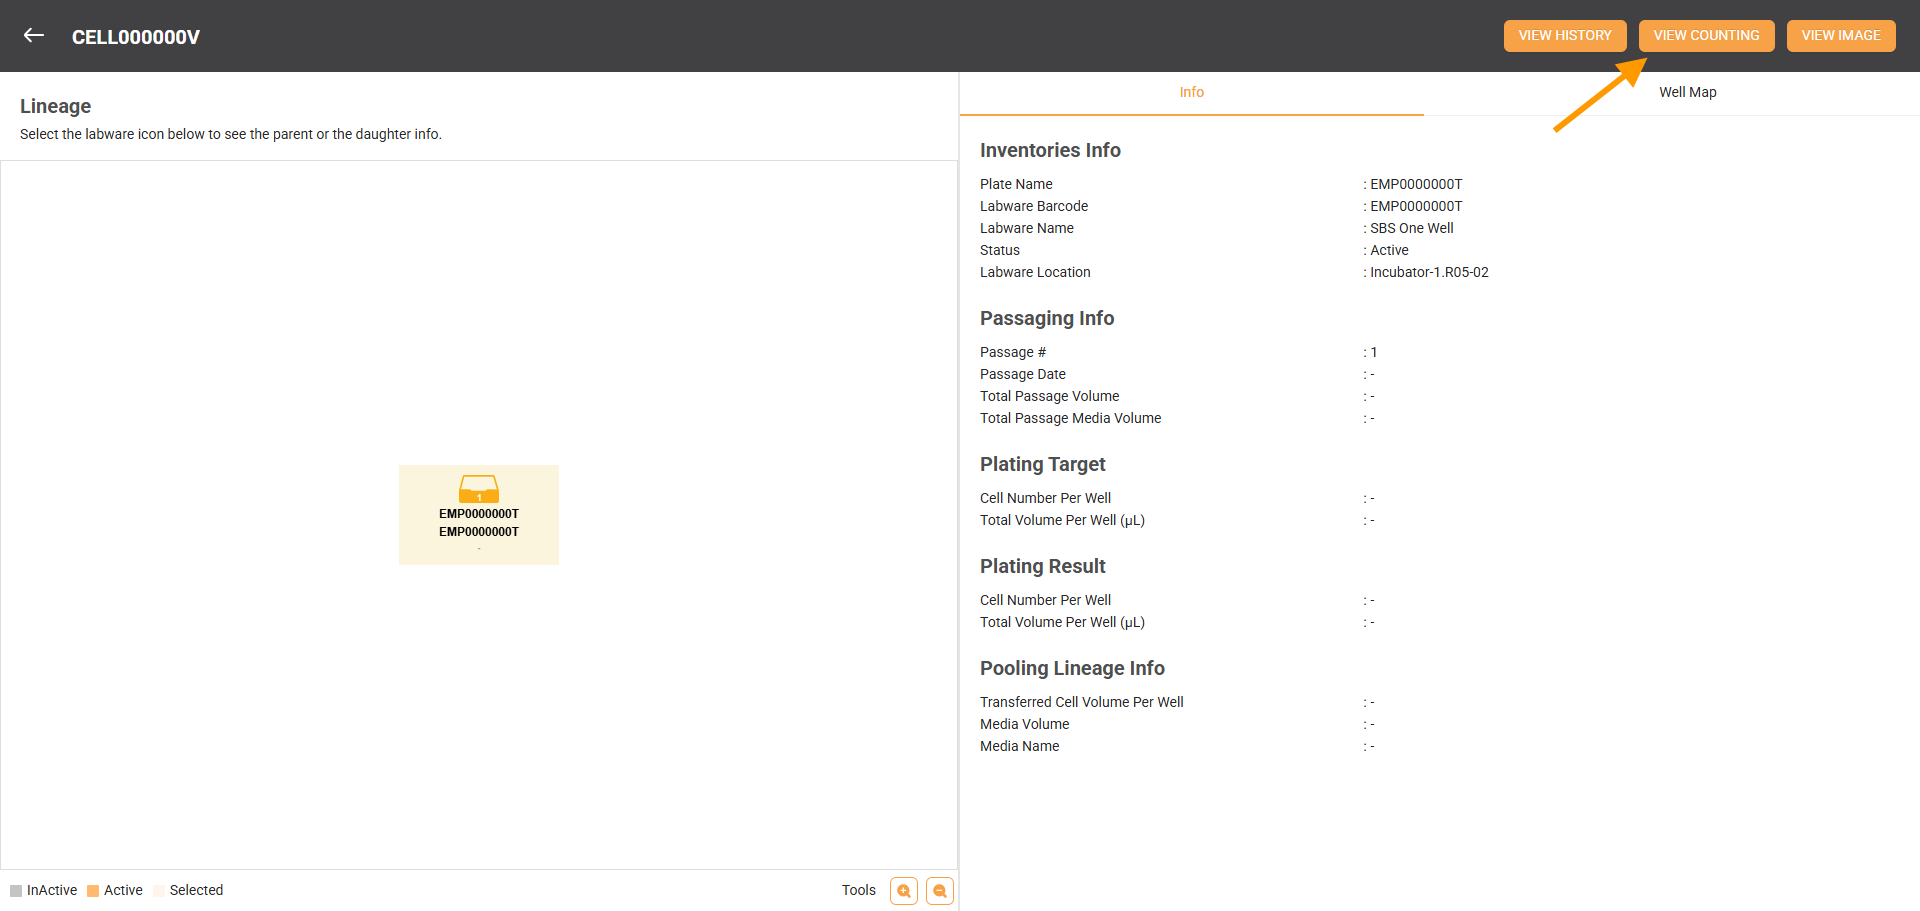
Select View Counting
Users can also download multiple images and count data by clicking the Download button in the top right corner, enabling offline review and further analysis.